In our first post on the basics of Facebook Insights, we learned the advantages of using the native analytics available just by logging in to your business’s page. Most of this data is fairly easy to navigate and information is readily found — and then there’s the beast that is exported Facebook Insights. This exported data includes massive Excel documents full of columns upon columns of data, complete with an overwhelming number of tabs. But, when armed with the proper knowledge, you can whittle that document down and focus only on the metrics that matter!
In part two of our guide to Facebook Insights, we’re going to unpack page-level data and post-level data, and I’ll share the few columns you actually need to focus on.
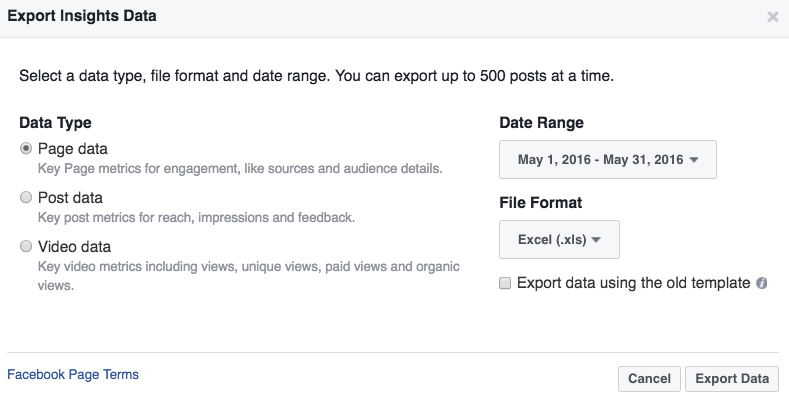
First thing’s first: Export your data
When logged into Facebook for Business, access Facebook Insights by clicking the Insights tab at the top of your page. Click the Export button in the top right corner. You’ll get a popup box where you can export both page data and post data, and then specify the date range you want to analyze. You’ll have to export these reports separately.
Know which key metrics are important
Facebook provides you with way more information than you need to make sound, strategic decisions. Take a deep breath, remain calm, and only focus on the columns and tabs that truly matter to those decisions.
Awareness: Fans reached
Focus on reach over impressions. It gives you a better idea of how many people are seeing your content. Beyond total reach, you’ll want to look at the differences between paid and organic reach.
You’ll find the number of fans reached in your post-level export file in column U (Lifetime Post Reach by People Who Like Your Page) of the Key Metrics tab. This tells you the total number of fans you reached, both organically and with paid promotion.
Compare the number of fans reached organically versus paid by subtracting the total in column W (Lifetime Paid Reach of a Post by People Who Like Your Page) from column U. Insert a column to the right of column U. Enter in the formula:
=U3-X3
for your first post data point (Column X being the Lifetime People Who Have Liked Your Page and Engaged With Your Post). Copy the formula down the column and you’ll have the organic reach for all posts.
Takeaway: Determining your organic reach will show you where the majority of your reach is coming from. With this knowledge, you can ascertain if your content is performing well organically or if your advertising budget is driving your content.
Engagement: Lifetime post consumers and your engagement rate
While it’s easy to quantify likes, reactions, and comments, they don’t tell the full story. To best understand your page engagement, report on them as a rate of the total page’s fan count.
A post consumer is a user who clicks anywhere on your post. This could be a like, comment, photo click, link click, video play, or share. Your post-level export report’s Lifetime Post Consumers (Column P) is the total number of people who clicked anywhere in your post.
To report an engagement rate based on the total page’s fan count, you’ll need to do a little bit of Excel magic. Look at the Lifetime Total Likes in column B of the page-level export file and copy the column. In the post-level export, insert a column to the right of column P and paste in the lifetime total likes. Then insert another column to the right and use the formula:
=P3/Q3
— or Lifetime Post Consumers divided by Lifetime Total Likes.
Takeaway: Determining the engagement rate for each post as a percentage of total likes will help you quickly identify which pieces of content your audience responds to best. It removes the barrier of varying total fans and their impact on your engagement KPIs, such as reactions and comments. Increasing numbers of reactions can also be deceiving based on page fan growth, so it’s important to focus on the percentage rate.
Conversions: Link clicks
While other platforms, like Google Analytics, provide deeper understanding of conversion goals, link clicks are a solid, high-level representation of how well you’re driving traffic to your website.
The fourth tab in your post-level export file (Lifetime Post Consumers by Type) has the number of link clicks for each post in column J. Don’t worry about other clicks and photo clicks — they don’t tell us much, especially when the goal is to drive traffic to your website.
Takeaway: If you’re including a link in your post, the goal is most likely to drive traffic to your website or landing page. Compare link clicks and other engagement metrics like reactions and comments. If a post gets 100 likes without a single link click, was it successful? Probably not. In fact, it might be time to revisit the content strategy and realign it with your strategy goals.
Advocacy: Shares
A share is one of the highest forms of flattery on social media. A share means a fan is willing to post your content to their feed for all their friends to see. It should be considered one of the top forms of fan advocacy among standard engagement metrics.
Share counts can be found on the second tab (Lifetime Talking About This) of the post-level export file in column L.
Takeaway: At a quick glance, you’ll be able to see what content is driving the highest number of shares. Run an analysis on the type of content that is most frequently shared and adjust your content strategy to include more posts of that nature.
Depending on your goals, you may need to customize what metrics you focus on, but these are a great starting point for your Facebook metrics. Check your metrics frequently and keep track of progress. Remember: A content strategy should constantly evolve and improve.
More Content

How to Create Personas With Google Analytics
Personas are critical for the success of your marketing efforts, digital or not. Strong personas are a reference for every department in your company or agency — from strategy to

The Marketer’s Power Quarter: Updating Lead Databases
This is the tenth in a 12-part series of quick-fix tips to improve your digital marketing results. Catch up on our last tip, and subscribe to our newsletter to get the

AI in Marketing: How to Get Started in 2018
One of the biggest buzzwords in marketing, and really across many industries, is artificial intelligence. For years, a majority of the public viewed AI as science fiction, but that’s starting
Leave A Comment